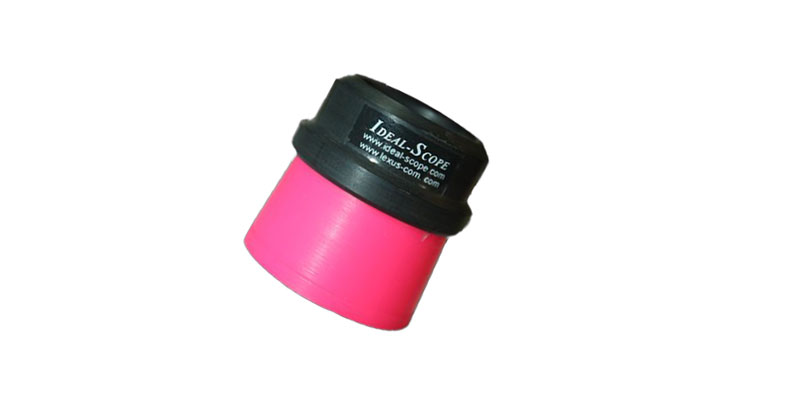
What is an idealscope?
Based on an early invention by professor Kazumi Okuda from the 1970s, the IdealScope is a tool that evaluates a diamond’s cut using colored reflectors. It is basically a 10x magnifying lens with red-reflecting material, between which a diamond is placed.

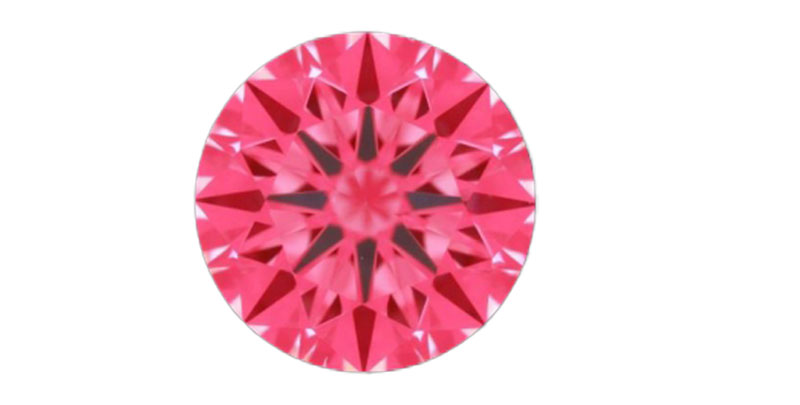
It contains a viewing hole in the center so that an observer can look in and see just how much red or pink is refracted from the stone. Other colors that you may see while observing a stone through the Ideal Scope are black and white, indicative of blocked or leaked light.
So let’s go through this thoroughly!
- Red – The color you want to see, because it means your stone is intense with passion… and also that light is being optimally reflected. (Measured at an angle of 0-75 degrees)
- Pink – Still indicates light reflection, but a less intense or less optimal amount
- White – The no bueno of colors, as it is an indication of light leakage.You want to see less white overall, but there are some acceptable cases when stones emit white “contrast leakage.”
- Black – Areas where light is blocked by the observer or the camera (Measured at an angle of 75-90 degrees)
The best use of Ideal Scope is in analyzing the optical symmetry of a diamond.
Here’s an example of a well-cut diamond with some contrast leakage:

Contrast leakage around the perimeter of a diamond can contribute to its visual appearance by subtly enhancing brightness, fire and scintillation.
ADVANTAGES AND DISADVANTAGES OF USING IDEALSCOPE
ADVANTAGES
- Can easily evaluate your inventory of round brilliants based on light performance
- Great tool for assessing brilliance and symmetry
- Very simple to use and interpret; does not require extensive knowledge to understand what you are seeing
DISADVANTAGES
- Does not work well in assessing fancy shapes
- Reduced performance in darker colored stones
- Needs backlighting to get the best image
Difference between ASET and Idealscope
ASET
- Colors you will see: red, green, blue, white, black
- Developed by AGS
- ASET images contain more information regarding the stones cut
- Tougher to interpret images; need additional knowledge to understand what you are seeing
- Can highlight the intensity of the light being reflected
- Only cut-grading tool that is endorsed by the scientific community
Both
- Reveals where light is leaked or reflected in a diamond
- Can be used on loose or mounted stonesSimple to use
- Can capture images for analysis by attaching the scopes to the lenses of a camera
Idealscope
- Colors you will see: red, pink, white, black
- Developed based on an invention by Mr. Okuda, from Japan
- Easy to interpret the images you see
When to request an ASET or Idealscope
If you are shopping for stones, you should always request an ASET or Ideal Scope image! While they may may not always be already available for 8 carat diamonds, most jewelers who are in a position to source these stones should be able to prove one for you.
Using both or either of these tools is critical to the cut-analysis of a diamond prior to purchase. Reputable diamond businesses should provide you with ASET or Ideal Scope images before you decide to buy a stone- and if they don’t readily have those images, then they should be ready to whip out the tool itself, to prove that they’re selling you an excellent stone. BUT many jewelers don’t do this!
Most are not well-read about a diamond’s optics and if they do know a thing or two, then they’re well aware of their poorly cut inventory. In an ideal world, a retailer would never even think about cheating their customers by selling them subpar stones at marked up prices; but in this world, it is quite often the case.
If you are shopping for diamonds, it would be beneficial for you to invest in an ASET or Ideal Scope. Which of these you decide to get is purely a matter of personal preference. Take a look at the chart above, comparing these two tools.

